Intermuscular Fat Is Sabotaging Bay Area Athletes' Performance

There is a specific kind of frustration that lives in high-performing athletes. You are consistent. Your training log is full. Your protein is tracked, your sleep is dialed, and your recovery protocols are more sophisticated than most people's entire fitness programs. And yet something is off. Power output plateaus. Speed stalls. Recovery takes longer than it should. You look fit. You feel fine. But the numbers disagree.
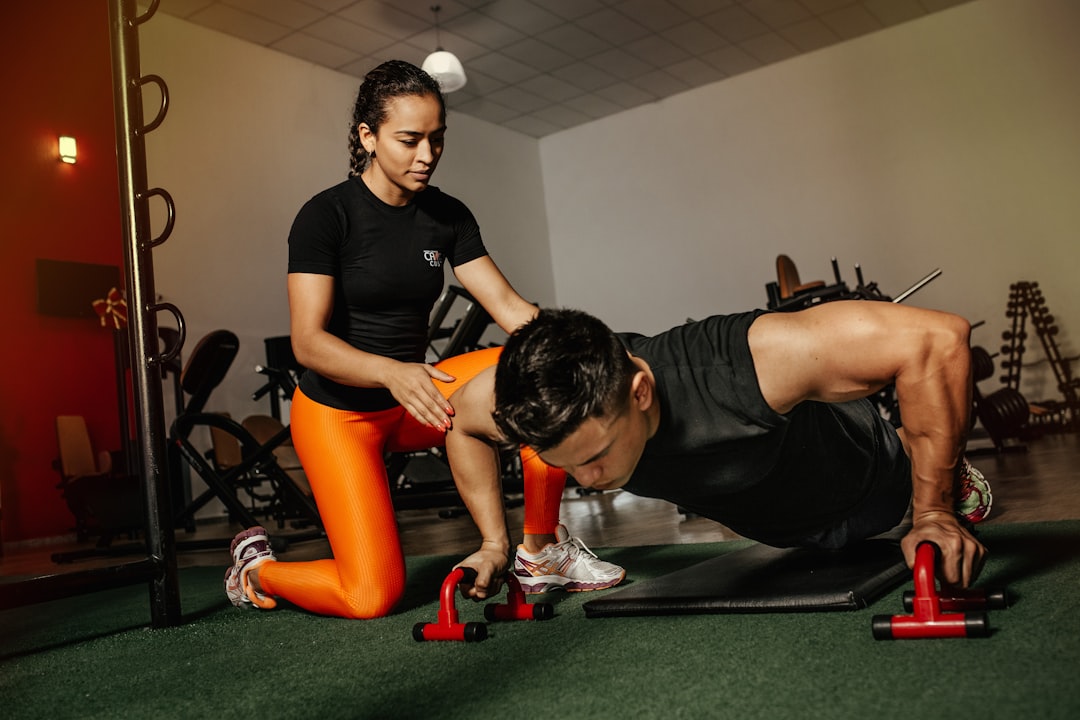
For a growing number of Bay Area athletes—cyclists in the East Bay, swimmers in Palo Alto, weekend warriors in SoMa, competitive runners threading through the Embarcadero—a DEXA scan is revealing the answer to a question they did not know to ask: how much fat is hiding inside your muscle tissue?
This is intermuscular fat. And it is one of the most underdiagnosed performance saboteurs in recreational and competitive sport.
What Intermuscular Fat Actually Is
Most people think about body fat in binary terms: you either have it or you do not. Subcutaneous fat sits under the skin. Visceral fat surrounds the organs. Both are visible in their own ways—one in the mirror, one on a waistline measurement. But intermuscular fat, sometimes called intramuscular adipose tissue (IMAT), is different. It lives within and between muscle fibers themselves. You cannot see it. You cannot feel it. A scale will not detect it. Even a skilled eye looking at your physique will miss it entirely.
What intermuscular fat does, however, is measurable—in watts on a power meter, in seconds on a track, in how your legs feel at mile eighteen of a long run.
Research consistently links elevated IMAT with reduced muscle fiber quality, slower contractile speed, impaired force production, and degraded neuromuscular efficiency. In practical terms: your muscles are there, but they are not operating at full capacity. The fat infiltration acts like static in a signal. The muscle is structurally present, but functionally compromised.
For athletes who are already lean by conventional standards, this is a particularly cruel irony. You have done everything right by the metrics most people track. But those metrics were never designed to catch this.
Why Standard Fitness Metrics Cannot Find It
Body weight tells you nothing about tissue composition. BMI, famously, tells you even less. Bioelectrical impedance devices—the kind built into Withings scales and handheld devices at supplement stores—use electrical resistance to estimate fat and lean mass, but they cannot distinguish between subcutaneous fat, visceral fat, and intermuscular fat. They produce a single number and call it body fat percentage. That number hides more than it reveals.
Even InBody machines, which are more sophisticated than consumer-grade impedance devices and common in gyms and sports medicine clinics, do not segment fat by depot. They give you a regional lean mass breakdown, which is useful, but they cannot tell you whether the fat within those regions is sitting between muscle bellies or infiltrating the fibers themselves.
Wearables are worse. Your Whoop and Oura ring are excellent for tracking HRV, sleep staging, and recovery load. They tell you nothing about the composition of your leg muscles. Garmin's body battery metric is a readiness proxy, not a tissue analysis.
This is what researchers call the description problem. You have data. But it is the wrong data. Steps, heart rate, sleep scores—these are behavioral and physiological signals, but they do not describe what is actually inside your body. Without that ground-truth measurement, your training and nutrition decisions are hypotheses without feedback loops.
What DEXA Scanning Actually Captures
Dual-energy X-ray absorptiometry—DEXA—remains the clinical gold standard for body composition measurement for a reason. It uses two X-ray beams at different energy levels to differentiate between bone mineral, lean soft tissue, and fat mass across every region of your body. The result is a segmented map of your composition: arms, legs, trunk, android region, gynoid region, and total body.
Critically, DEXA's fat mass measurements include all fat depots within a given region—subcutaneous, visceral, and intermuscular. A skilled analyst reading your scan can identify regional fat-to-lean ratios that are disproportionate to what your overall body fat percentage would predict. This is the signature of intermuscular fat accumulation: your lean mass numbers look adequate on paper, but the regional fat percentages within muscle-dense areas like the legs and trunk are elevated relative to your training profile and activity level.
At Kalos, our performance analysts review these patterns across thousands of scans. When a competitive cyclist shows 17% total body fat but carries a disproportionate fat fraction in their quadriceps region, that discrepancy is data. It explains things. It changes what we recommend.
If you have been searching for where to get a DEXA scan near me or where can I get a DEXA scan for body fat, the answer in the Bay Area is Kalos—with locations in San Francisco, Palo Alto, and San Jose. But what matters more than access to the hardware is what happens after the scan. Raw numbers without interpretation are noise. Interpretation without a coaching framework is incomplete. The scan is the starting point.
Who Is Most at Risk
Intermuscular fat does not exclusively target aging athletes, though the risk does accelerate after forty. Several patterns consistently appear in Kalos scan data across our 3,000-plus scans completed to date.
High-volume endurance athletes with low resistance training volume. Cyclists, runners, and swimmers who log enormous aerobic hours without proportional strength work often develop a lean-but-fat-infiltrated muscle profile. Endurance training preserves cardiovascular fitness but does not prevent IMAT accumulation the way progressive resistance training does. If your training week is ninety percent cardio and ten percent strength, your muscle tissue quality is likely suffering even if your VO2 max is excellent.
Athletes returning from injury. Immobilization accelerates fat infiltration into muscle tissue dramatically. A six-week ankle sprain, a torn ACL, a shoulder reconstruction—all of these create windows where the affected limb rapidly accumulates IMAT. Rehabilitation protocols restore range of motion and strength, but they often do not fully reverse fat infiltration at the tissue level. Athletes who return to sport after injury frequently report that something feels different even after they have cleared return-to-play criteria. Sometimes what they are feeling is real, and it is measurable.
Lean athletes who have dieted aggressively. Severe caloric restriction, especially without adequate protein and resistance training, can result in simultaneous muscle loss and fat infiltration—a particularly damaging combination. The body loses contractile tissue and replaces it partially with lipid deposits within the remaining muscle architecture. This pattern appears consistently in athletes who have followed summer cutting protocols without prioritizing lean mass preservation.
Tech workers who train but sit for ten hours a day. This is a Bay Area-specific pattern. A significant portion of Kalos members are engineers, PMs, and data scientists who train hard in the mornings and then spend the rest of their day sedentary. Research on prolonged sitting shows that extended inactivity promotes fat infiltration in the muscles of the lower body even in individuals who meet physical activity guidelines. Your forty-five-minute morning ride does not fully counteract eight hours of desk-bound inactivity in terms of muscle tissue quality.
The Performance Impact Is Not Abstract
There is a temptation to treat IMAT as a theoretical concern—something worth knowing but not urgently actionable. That framing underestimates the measurable impact on athletic output.
Force production is the most direct effect. Muscle fibers surrounded by or infiltrated with adipose tissue generate less force per unit of cross-sectional area than clean muscle tissue. For a cyclist, this shows up as reduced peak wattage relative to what training load and muscle size would predict. For a runner, it manifests as reduced ground contact efficiency—you are putting in the effort but losing the return.
Neuromuscular recruitment is the second mechanism. Fat infiltration within and between muscle fascicles disrupts the electrical signaling that drives coordinated muscle activation. Motor units fire less efficiently. The muscle does not activate as a synchronized unit. This is measurable in electromyography studies and observable in performance data as a reduction in explosive capacity—the ability to produce force rapidly—even when maximum strength appears maintained.
Recovery is the third vector. Muscle tissue quality affects not just output but repair. Higher IMAT is associated with increased inflammatory signaling within the muscle environment. Post-workout inflammation resolves more slowly. This compresses the effective recovery window between hard sessions and contributes to the kind of chronic, low-grade fatigue that athletes often attribute to overtraining when the actual cause is tissue-level inefficiency.
What DEXA Data Shows About Training Responses
One of the clearest patterns in Kalos scan data is the asymmetric training response. Two athletes with identical training programs, identical body weight, and similar total lean mass can show dramatically different regional body composition profiles—and dramatically different performance trajectories.
The athlete whose scan shows clean, fat-infiltration-free muscle tissue responds to progressive overload predictably. Load increases, contractile tissue grows, performance improves. The athlete whose scan shows elevated regional fat fractions does not respond the same way. The training stimulus lands on compromised tissue. Adaptations are blunted. Progress stalls.
This is why the muscle gains stalling problem is so frustrating without a scan: the program looks correct on paper. The effort is real. But the substrate the effort is being applied to is not what it appears to be from the outside.
The prescription that follows from this data is not complicated, but it requires knowing the problem exists in the first place. Resistance training—specifically progressive overload focused on the affected muscle groups—is the most evidence-supported intervention for reducing IMAT. This is not generic strength training advice. It is targeted programming based on where the fat infiltration is concentrated, which you cannot identify without a regional body composition breakdown.
Muscle Symmetry Adds Another Layer
DEXA scans also reveal lean mass asymmetry between limbs—a separate but related issue that frequently co-occurs with IMAT in the Kalos scan population. An athlete may carry measurably more lean mass in their dominant leg, or show a significant left-right discrepancy in arm composition after years of sport-specific training.
These asymmetries matter for two reasons. First, they create compensatory movement patterns that increase injury risk over time. Second, they indicate that training load is not being distributed evenly across muscle groups, which means some tissues are being systematically undertrained while others are overloaded. If you are searching for a DEXA scan near me specifically to understand your injury risk, muscle imbalance data from DEXA is one of the most actionable outputs you can get.
The Kalos Approach: Measurement Then Transformation
Kalos is not a DEXA scan company. The scan is the entry point—the measurement layer that makes everything else meaningful. What follows the scan is where the actual work happens.
After your scan at any of our Bay Area locations, a NASM-certified performance analyst walks through your results in a dedicated analysis session. This is not a printout hand-off. It is a structured conversation about what your specific numbers mean for your specific goals—whether those goals sit closer to the performance vertex, the aesthetics vertex, or the longevity vertex of your health triangle.
For athletes concerned about IMAT, that conversation covers regional fat-to-lean ratios, limb symmetry, appendicular lean mass index relative to age-matched norms, and a realistic picture of what is driving the patterns we see. From there, coaching members get a personalized program that addresses both the exercise and nutrition variables that research supports for IMAT reduction—not a generic protocol, but one built from your actual scan data.
Monthly retesting is standard for coaching members. This is the feedback loop that makes coaching defensible. If the intervention is working—IMAT-associated regional fat declining, lean mass growing, performance metrics improving—the data confirms it. If it is not working, we adjust. The data tells us what works for you, not what worked for someone else in a study. This is the bottom-up methodology: measure, adjust, iterate.
All Kalos services are HSA and FSA eligible, which matters for athletes who are investing seriously in their health and want to use pre-tax dollars efficiently.
The Broader Picture: Performance Is Not Just About Looking Fit
The fitness industry has a long history of conflating aesthetics with performance capacity. Lean athletes are assumed to be performing optimally because they look the part. This assumption fails athletes constantly, and intermuscular fat is one of the clearest examples of why.
You can have a six-pack and a significant IMAT burden in your quadriceps. You can run a seven-minute mile and carry excess fat infiltration in your hamstrings. You can be the leanest person on your cycling team and still be losing performance to tissue quality issues that none of your fitness metrics have ever flagged.
The athletes who are closing that gap in the Bay Area are not training harder than you. They are training with better information. They know what is inside their muscles, not just how much their muscles weigh. That distinction—between the quantity of lean mass and the quality of lean tissue—is where the next frontier of athletic optimization lives.
And right now, DEXA scanning is the only consumer-accessible tool that can reliably illuminate it. If you have been wondering where can I get a DEXA scan for body fat in the Bay Area, or looking for a DEXA scan near me that goes beyond a number and into a real performance conversation, Kalos is where that conversation starts.
Your effort is not the problem. Your data is.

Ready to measure what matters?
Book your DEXA scan today and stop guessing about your health.